IPCC AR6 SYR LR Figure 2.4 (b)
Market Adoption
This panel shows the cumulative global adoption for each technology, in GW of installed capacity for renewable energy and in millions of vehicles for battery-electric vehicles. The vertical dashed line is placed in 2010 to indicate the change over the past decade. The electricity production share reflects different capacity factors; for example, for the same amount of installed capacity, wind produces about twice as much electricity as solar PV. Renewable energy and battery technologies were selected as illustrative examples because they have recently shown rapid changes in costs and adoption, and because consistent data are available. Other mitigation options assessed in the WGIII report are not included as they do not meet these criteria.
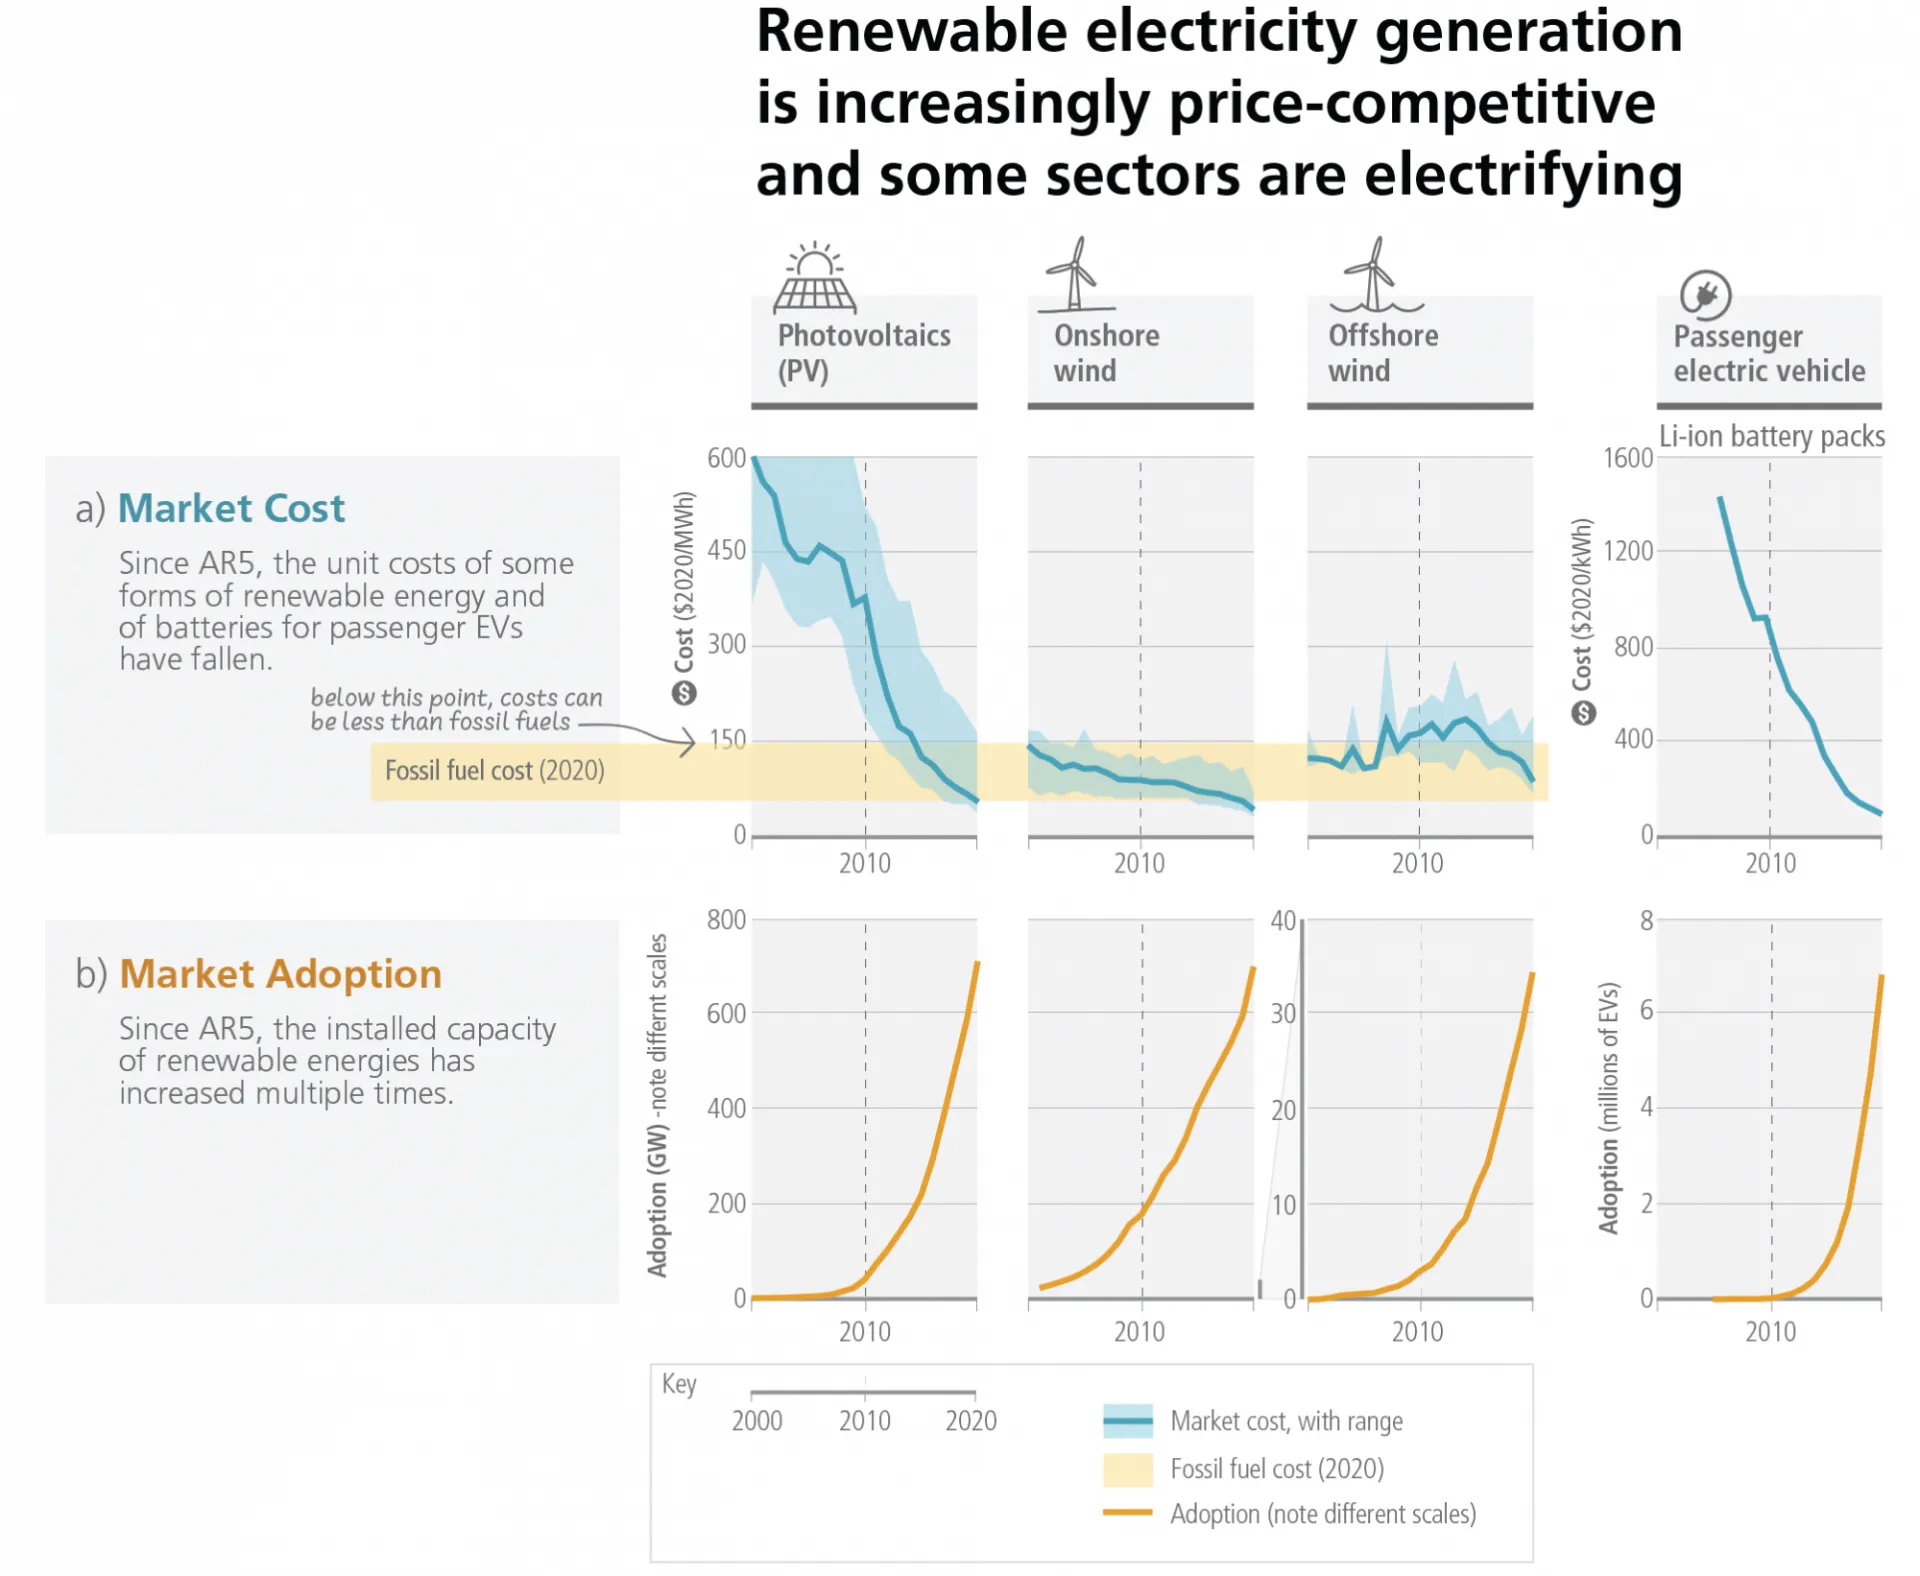
The lower panel of the figure: AR6 LR Figure 2.4 (b): Market Adoption
Data download: IPCC AR6 SYR LR Figure 2.4 (b) (Excel Workbook, ~15 KB)
Data Citation:
IPCC, 2024. IPCC AR6 Synthesis Report LR Figure 2.4 (b): Market Adoption. Palisades, New York: NASA Socioeconomic Data and Applications Center (SEDAC). https://doi.org/10.7927/hzk3-7k35. Accessed DAY MONTH YEAR
Citation of IPCC Report:
IPCC, 2023: Climate Change 2023: Synthesis Report. Contribution of Working Groups I, II and III to the Sixth Assessment Report of the Intergovernmental Panel on Climate Change [Core Writing Team, H. Lee and J. Romero (eds.)]. IPCC, Geneva, Switzerland, 184 pp. https://doi.org/10.59327/IPCC/AR6-9789291691647.