IPCC AR6 SYR LR Figure 3.1 (a)
Simulated annual maximum daily temperature change
These maps are based on model simulations and illustrate the change in annual multi-model mean temperatures at a global warming level of 1°C. The data represents the 20-year average global surface temperature change relative to the 1850–1900 baseline, expressed per degree of global warming (°C) over the period 1850–2020.
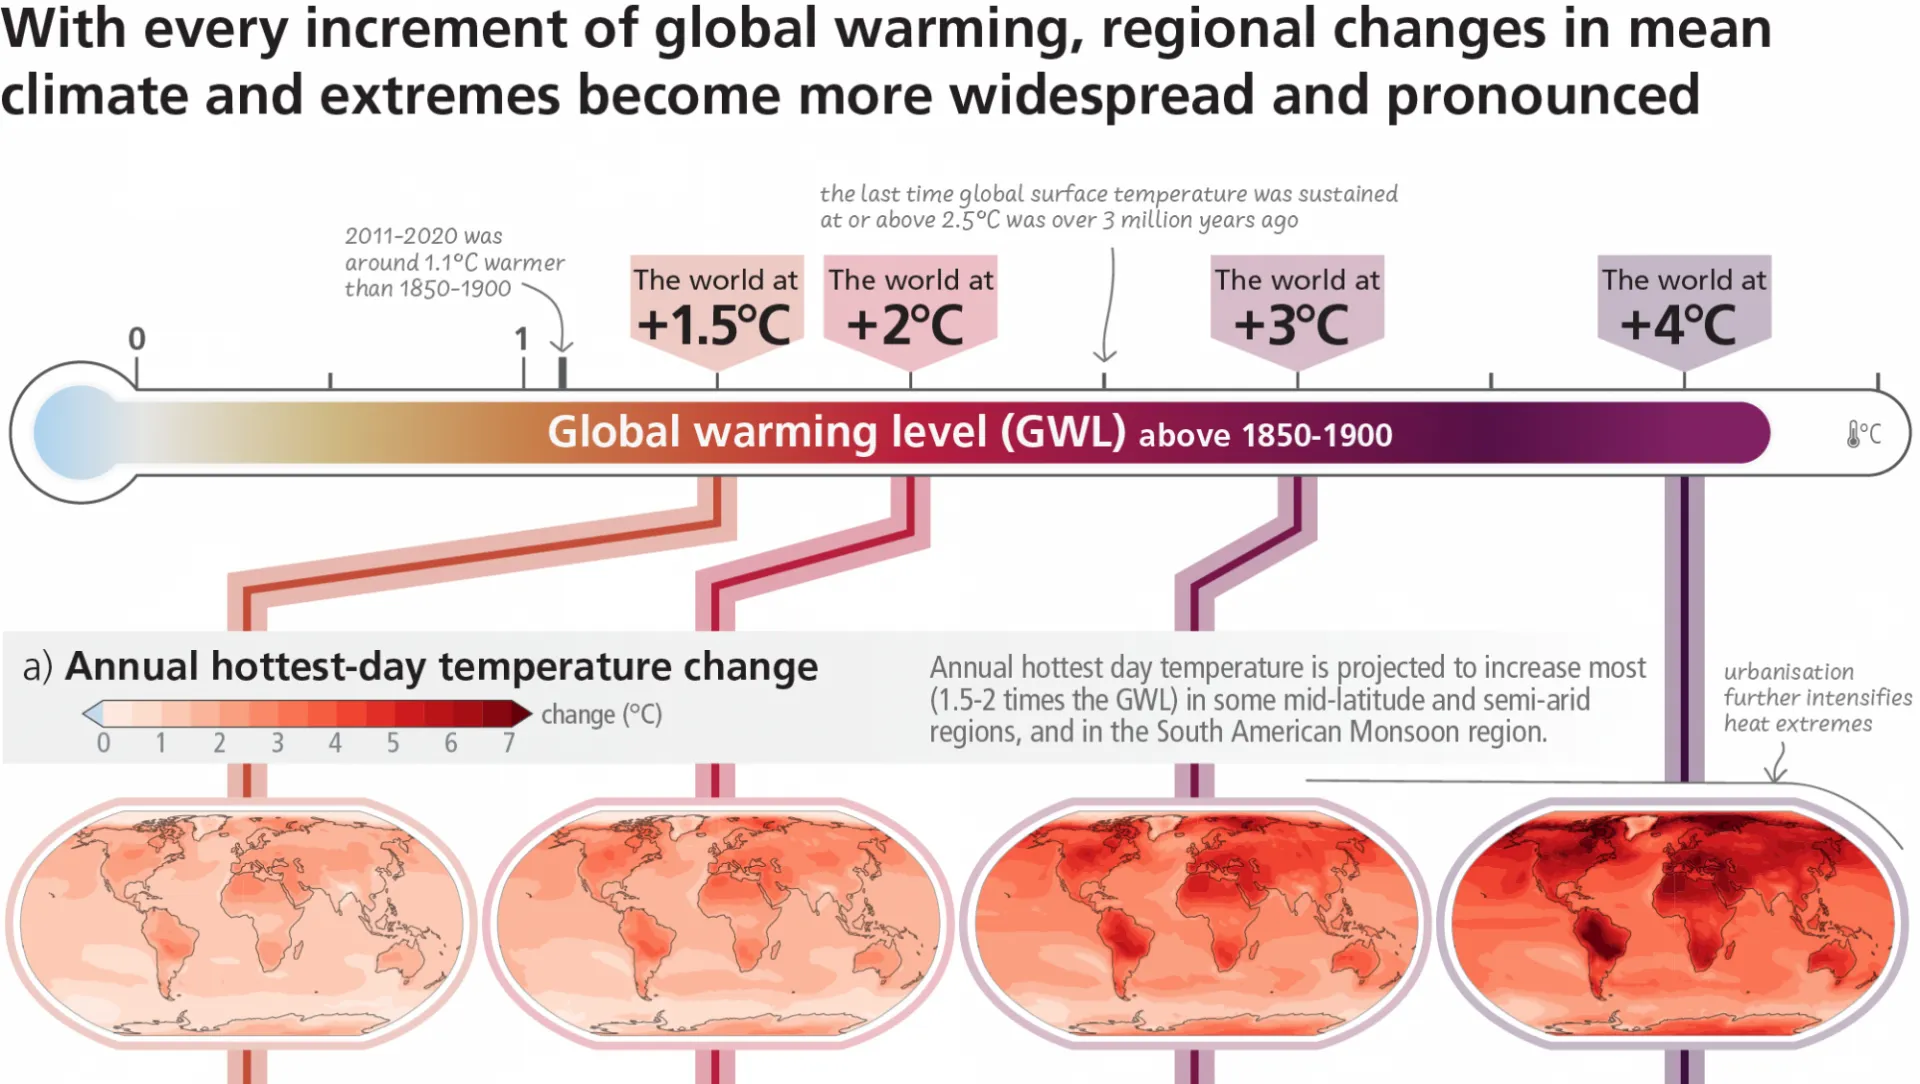
Figure AR6 SYR Figure 3.1 (a): Simulated annual maximum daily temperature change
Data download: IPCC AR6 SYR LR Figure 3.1 (a) (Zipfile, ~326 KB)
Data Citation:
IPCC, 2025. IPCC AR6 Synthesis Report LR Figure 3.1 (a): Simulated annual maximum daily temperature change. Palisades, New York: NASA Socioeconomic Data and Applications Center (SEDAC). https://doi.org/10.7927/18s4-a866. Accessed DAY MONTH YEAR.
Citation of IPCC Reports:
IPCC, 2023: Climate Change 2023: Synthesis Report. Contribution of Working Groups I, II and III to the Sixth Assessment Report of the Intergovernmental Panel on Climate Change [Core Writing Team, H. Lee and J. Romero (eds.)]. IPCC, Geneva, Switzerland, 184 pp. https://doi.org/10.59327/IPCC/AR6-9789291691647.