IPCC AR6 SYR LR Figure 3.6 (b)
Total GHG, CO2 and CH4 emissions and timing of reaching net-zero while keeping warming to 2°C
GHG, CO2 and CH4 emissions over time (in GtCO2eq) with historical emissions, projected emissions in line with policies implemented until the end of 2020 (grey), and pathways consistent with temperature goals in colour (blue, purple, and brown, respectively). This figure shows pathways that limit warming to 2°C (>66%) (C3).
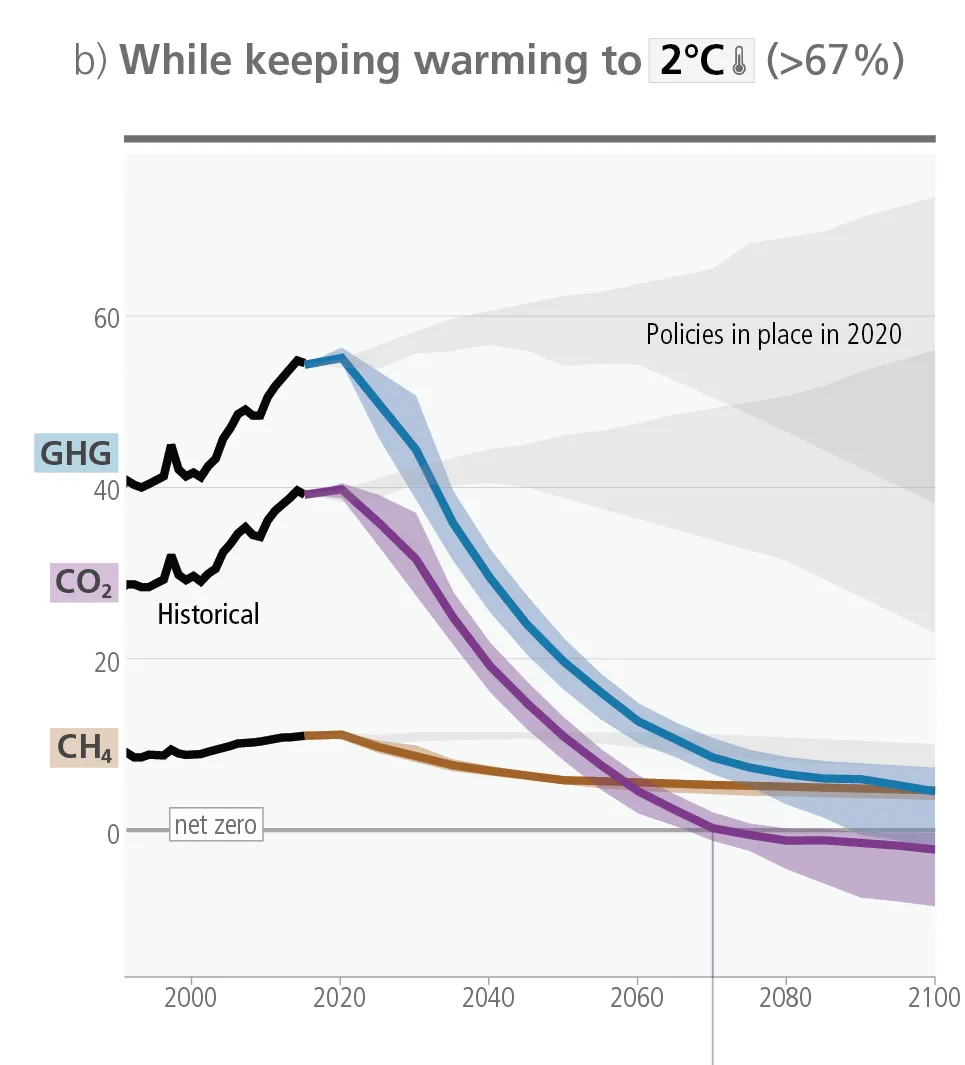
Figure AR6 LR Figure 3.6 (b): Total GHG, CO2 and CH4 emissions and timing of reaching net-zero while keeping warming to 2°C
Data download: IPCC AR6 SYR LR Figure 3.6 (b) (Excel Workbook, ~21.2 KB)
Data Citation:
IPCC, 2025. IPCC AR6 Synthesis Report LR Figure 3.6 (b): Total GHG, CO2 and CH4 emissions and timing of reaching net-zero while keeping warming to 2°C. Palisades, NY: Center for Integrated Earth System Information (CIESIN). https://doi.org/10.7927/d4v6-3b75. Accessed DAY MONTH YEAR
Citation of IPCC Report:
IPCC, 2023: Climate Change 2023: Synthesis Report. Contribution of Working Groups I, II and III to the Sixth Assessment Report of the Intergovernmental Panel on Climate Change [Core Writing Team, H. Lee and J. Romero (eds.)]. IPCC, Geneva, Switzerland, 184 pp. https://doi.org/10.59327/IPCC/AR6-9789291691647.