IPCC AR6 SYR SPM.5 (c)
Global methane (CH4) emissions
Development of global methane (CH₄) emissions pathways consistent with implemented policies and mitigation strategies. The figure shows pathways with colored ranges denoting the 5th to 95th percentiles across models. The red range represents emissions pathways assuming policies that were implemented by the end of 2020, as well as the Nationally Determined Contributions (NDCs). The green range shows pathways limiting global warming to 2°C (>67%), while the blue range shows pathways limiting warming to 1.5°C (>50%) with no or limited overshoot. The black line depicts past emissions (2000–2015). The error bar in 2015 indicates the 5th to 95th percentile uncertainty range of non-harmonized emissions across pathways. The figure also includes a "net zero" line indicating the long-term goal for methane emissions reduction.
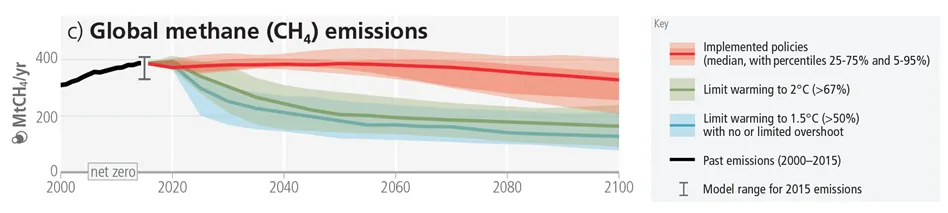
Figure AR6 SPM.5 (c): Global methane (CH4) emissions
Data download: IPCC AR6 SYR SPM.5 (c) (Excel Workbook, ~22.2 KB)
Data Citation:
IPCC, 2024. IPCC AR6 Synthesis Report SPM.5 (c): Global methane (CH4) emissions. Palisades, New York: NASA Socioeconomic Data and Applications Center (SEDAC). https://doi.org/10.7927/7q5a-dc02. Accessed DAY MONTH YEAR
Citation of IPCC Report:
IPCC, 2023: Climate Change 2023: Synthesis Report. Contribution of Working Groups I, II and III to the Sixth Assessment Report of the Intergovernmental Panel on Climate Change [Core Writing Team, H. Lee and J. Romero (eds.)]. IPCC, Geneva, Switzerland, 184 pp. https://doi.org/10.59327/IPCC/AR6-9789291691647.