IPCC AR6 SYR SPM.5 (d)
The associated timing of when GHG and CO2 emissions reach net zero
This panel shows the associated timing of when GHG and CO2 emissions reach net zero. Coloured ranges denote the 5th to 95th percentile across the global modelled pathways falling within a given category. Ranges of modelled pathways that limit warming to 1.5°C (>50%) with no or limited overshoot are shown in light blue (category C1) and pathways that limit warming to 2°C (>67%) are shown in green (category C3). Global emission pathways that would limit warming to 1.5°C (>50%) with no or limited overshoot and also reach net zero GHG in the second half of the century do so between 2070-2075.
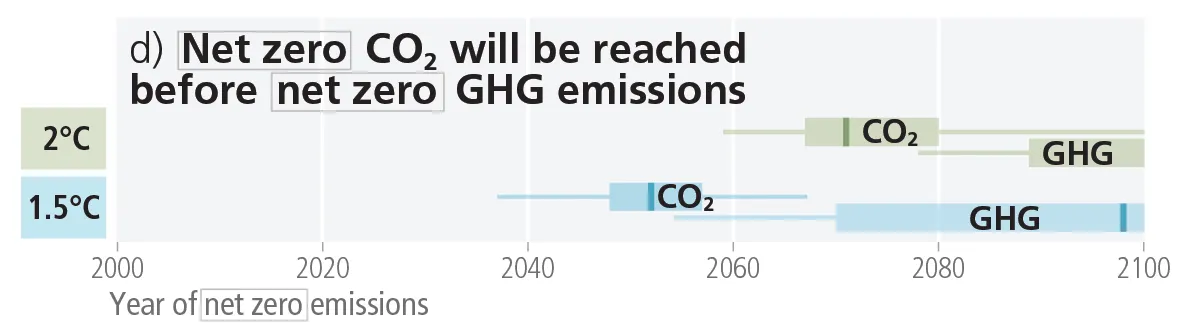
Figure AR6 SPM.5 (d): Net zero CO2 will be reached before net zero GHG emissions
Data download: IPCC AR6 SYR SPM.5 (d) (Excel Workbook, 72 KB)
Data Citation:
IPCC, 2024. IPCC AR6 Synthesis Report SPM.5 (d): The associated timing of when GHG and CO2 emissions reach net zero. Palisades, New York: NASA Socioeconomic Data and Applications Center (SEDAC). https://doi.org/10.7927/kgra-jt25. Accessed DAY MONTH YEAR
Citation of IPCC Report:
IPCC, 2023: Climate Change 2023: Synthesis Report. Contribution of Working Groups I, II and III to the Sixth Assessment Report of the Intergovernmental Panel on Climate Change [Core Writing Team, H. Lee and J. Romero (eds.)]. IPCC, Geneva, Switzerland, 184 pp. https://doi.org/10.59327/IPCC/AR6-9789291691647.